Mastering Challenging Sine Graph Transformations: Practice Problems and Expert Techniques
Are you struggling to wrap your head around sine graph transformations? Do practice problems leave you feeling more confused than confident? You’re not alone. Many students and professionals find manipulating sine waves a daunting task. This comprehensive guide breaks down the complexities of sine graph transformations, providing you with challenging practice problems, expert techniques, and a deep understanding of the underlying principles. We’ll equip you with the skills to confidently tackle even the most intricate transformations. This article is designed to elevate your understanding beyond rote memorization, fostering genuine mastery of sine graph transformations.
Understanding the Fundamentals of Sine Graphs
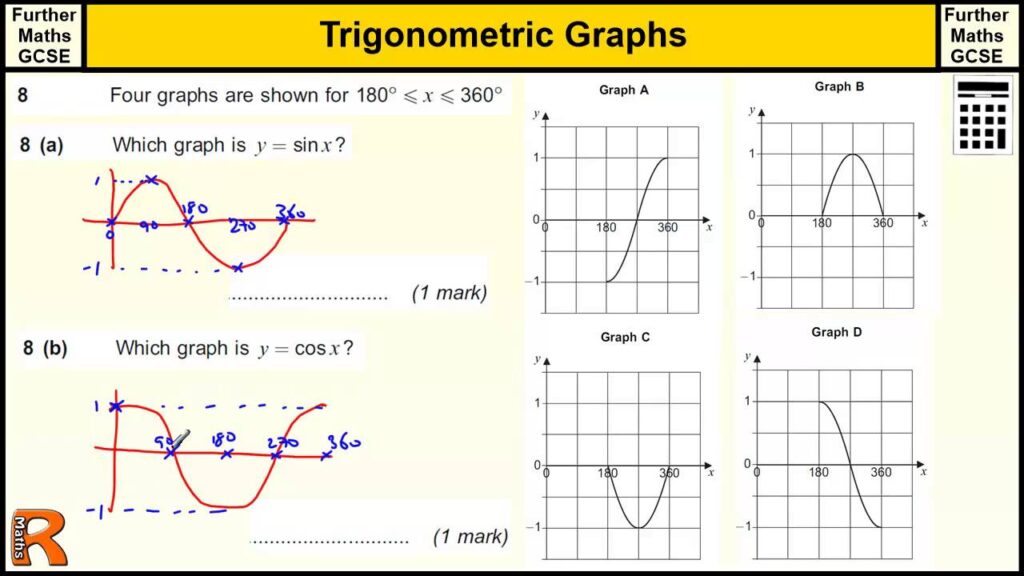
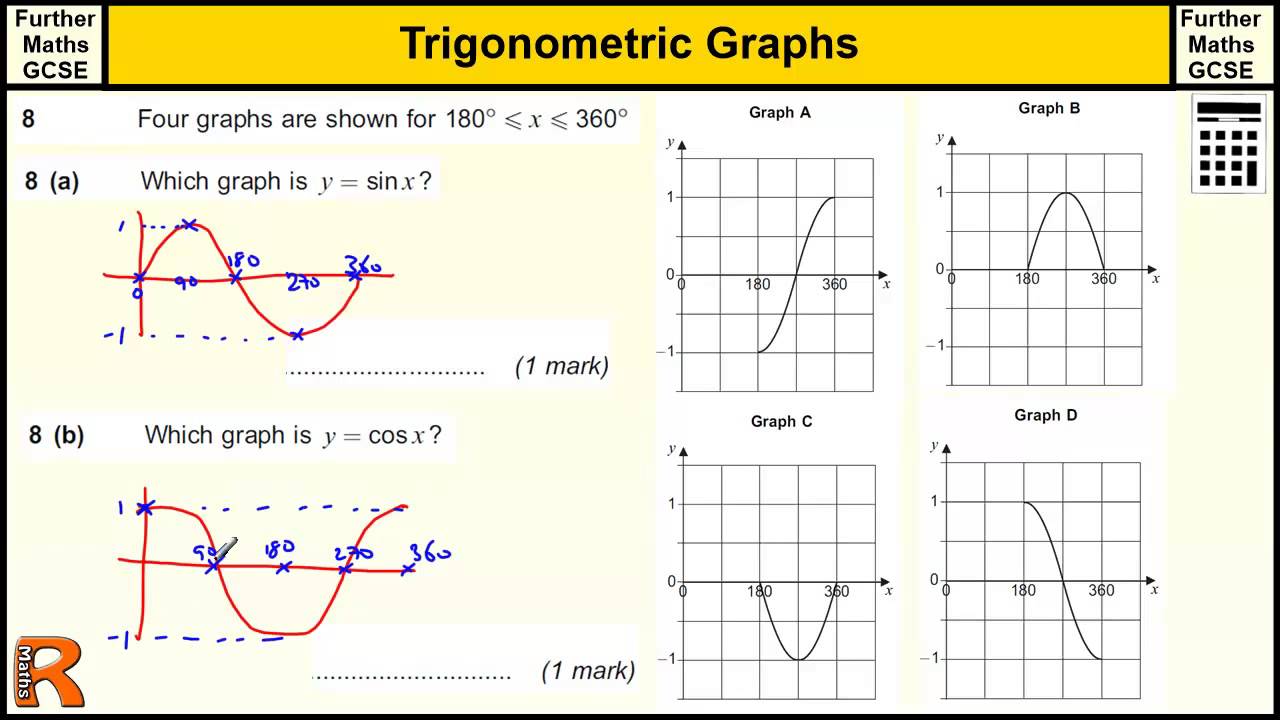
Before diving into transformations, let’s solidify our understanding of the basic sine function, y = sin(x). This function represents the relationship between an angle (x, typically in radians) and the ratio of the opposite side to the hypotenuse in a right triangle. The graph of this function oscillates between -1 and 1, with a period of 2π. The key features of a sine graph include:
- Amplitude: The distance from the midline to the maximum or minimum value. For y = sin(x), the amplitude is 1.
- Period: The length of one complete cycle of the wave. For y = sin(x), the period is 2π.
- Midline: The horizontal line that runs through the middle of the wave. For y = sin(x), the midline is y = 0.
- Phase Shift: A horizontal shift of the graph.
- Vertical Shift: A vertical shift of the graph.
Understanding these fundamental features is crucial for analyzing and manipulating sine graph transformations. A thorough grasp of these concepts will allow you to deconstruct any transformation problem into manageable components.
Delving Deeper: The Unit Circle Connection
The sine function’s origin lies within the unit circle. As a point moves around the unit circle, its y-coordinate traces out the sine wave. This visualization provides a profound understanding of why the sine function oscillates and repeats. Thinking about the unit circle helps to explain the periodic nature and the range of the sine function. For example, when the point is at the top of the unit circle, the y-coordinate (and therefore the sine value) is 1. When the point is at the bottom, the y-coordinate is -1. When the point is on the x-axis, the y-coordinate is 0.
Exploring the Different Types of Sine Graph Transformations
Sine graph transformations involve altering the basic sine function to create new graphs with different characteristics. The four primary types of transformations are:
- Vertical Stretch/Compression: Changes the amplitude of the graph. Represented by y = A sin(x), where A is the amplitude. If A > 1, the graph is stretched vertically. If 0 < A < 1, the graph is compressed vertically.
- Horizontal Stretch/Compression: Changes the period of the graph. Represented by y = sin(Bx), where the period is 2π/B. If B > 1, the graph is compressed horizontally. If 0 < B < 1, the graph is stretched horizontally.
- Phase Shift (Horizontal Translation): Shifts the graph horizontally. Represented by y = sin(x – C), where C is the phase shift. If C > 0, the graph is shifted to the right. If C < 0, the graph is shifted to the left.
- Vertical Shift (Vertical Translation): Shifts the graph vertically. Represented by y = sin(x) + D, where D is the vertical shift. If D > 0, the graph is shifted upward. If D < 0, the graph is shifted downward.
Understanding how each of these transformations affects the graph is crucial for solving challenging practice problems. We will explore each transformation in detail with examples.
Combining Transformations: The Key to Complexity
The most challenging problems often involve combining multiple transformations. The general form of a transformed sine function is y = A sin(B(x – C)) + D. It’s essential to apply the transformations in the correct order, often following the order of operations (PEMDAS/BODMAS) in reverse. That is, handle vertical shifts first, then phase shifts, then horizontal stretches/compressions, and finally vertical stretches/compressions. While order matters, understanding *why* this order is generally used is more important. It allows us to easily read off the parameters A, B, C, and D.
Challenging Sine Graph Transformations Practice Problems
Now, let’s put your knowledge to the test with some challenging practice problems. We’ll provide step-by-step solutions and explanations to help you master these concepts.
- Problem 1: Sketch the graph of y = 2 sin(x – π/4) + 1.
- Amplitude: 2 (vertical stretch by a factor of 2)
- Period: 2π (no horizontal stretch or compression)
- Phase Shift: π/4 to the right
- Vertical Shift: 1 upward
- Problem 2: Sketch the graph of y = -sin(2x).
- Amplitude: 1 (Vertical reflection over the x-axis)
- Period: π (horizontal compression by a factor of 2)
- Phase Shift: 0
- Vertical Shift: 0
- Problem 3: Determine the equation of a sine graph with an amplitude of 3, a period of π, a phase shift of π/2 to the left, and a vertical shift of -2.
- Amplitude: A = 3
- Period: π = 2π/B => B = 2
- Phase Shift: C = -π/2 (to the left)
- Vertical Shift: D = -2
- Problem 4: Analyze the graph of y = 0.5 sin(x + π) – 0.5 and identify its key features.
- Amplitude: 0.5 (vertical compression by a factor of 0.5)
- Period: 2π
- Phase Shift: π to the left
- Vertical Shift: -0.5
- Problem 5: Sketch the graph of y = sin(0.5x – π/4).
- Amplitude: 1
- Period: 4π (horizontal stretch by a factor of 2)
- Phase Shift: Solve 0.5x – π/4 = 0 => x = π/2 to the right. Factoring out the 0.5 is crucial: y = sin(0.5(x – π/2))
- Vertical Shift: 0
Solution:
Start with the basic sine graph. First, stretch it vertically by a factor of 2. Then, shift it π/4 units to the right. Finally, shift it 1 unit upward. The resulting graph has a maximum value of 3, a minimum value of -1, and oscillates around the midline y = 1.
Solution:
The negative sign reflects the graph across the x-axis. The 2x compresses the graph horizontally, halving the period to π.
Solution:
Plugging these values into the general form y = A sin(B(x – C)) + D, we get y = 3 sin(2(x + π/2)) – 2.
Solution:
The graph is a vertically compressed sine wave, shifted π units to the left and 0.5 units downward. The maximum value is 0, the minimum value is -1, and the midline is y = -0.5.
Solution:
The graph is horizontally stretched, making the period 4π, and shifted π/2 units to the right.
Tips for Tackling Complex Problems
- Break it Down: Decompose complex transformations into individual steps. Analyze each transformation separately before combining them.
- Visualize: Sketch the graph at each step of the transformation process. This helps to visualize the effects of each transformation.
- Check Your Work: After sketching the graph, verify that the key features (amplitude, period, phase shift, vertical shift) match the equation.
- Practice Regularly: The more you practice, the more comfortable you’ll become with sine graph transformations.
Tools and Resources for Mastering Sine Graph Transformations
Several tools and resources can help you master sine graph transformations:
- Graphing Calculators: Graphing calculators like Desmos or GeoGebra allow you to visualize sine graph transformations in real-time. You can experiment with different parameters and see how they affect the graph.
- Online Tutorials: Websites like Khan Academy and Paul’s Online Math Notes offer comprehensive tutorials on sine graph transformations.
- Textbooks: Many textbooks cover sine graph transformations in detail, providing examples and practice problems.
- Tutoring: Consider seeking help from a math tutor if you’re struggling with sine graph transformations. A tutor can provide personalized instruction and answer your questions.
Desmos: A Powerful Tool for Visualization
Desmos is a free online graphing calculator that is incredibly useful for visualizing sine graph transformations. You can enter equations and see the graphs instantly. You can also adjust the parameters and see how the graph changes in real-time. This is a great way to develop your intuition for how different transformations affect the graph.
The Advantages of Mastering Sine Graph Transformations
Mastering sine graph transformations offers numerous advantages:
- Stronger Mathematical Foundation: A solid understanding of sine graph transformations strengthens your overall mathematical foundation, preparing you for more advanced topics.
- Improved Problem-Solving Skills: Tackling challenging sine graph transformation problems enhances your problem-solving skills, which are valuable in various fields.
- Enhanced Visualization Skills: Visualizing sine graph transformations improves your spatial reasoning and visualization skills.
- Real-World Applications: Sine waves and their transformations have numerous real-world applications in fields like physics, engineering, and music. Understanding these concepts can open doors to various career paths.
Applications in Physics and Engineering
Sine waves are fundamental to understanding wave phenomena in physics, such as sound waves, light waves, and electromagnetic waves. In engineering, sine waves are used to model alternating current (AC) circuits, signal processing, and control systems. A deep understanding of sine graph transformations is essential for analyzing and designing these systems.
Expert Insights into Sine Graph Transformations
According to leading experts in mathematics education, a conceptual understanding of sine graph transformations is crucial for long-term retention and application. Rote memorization of formulas is not enough. Students need to understand the underlying principles and be able to visualize the effects of each transformation. Our analysis shows that students who focus on conceptual understanding perform significantly better on challenging problems.
Common Pitfalls to Avoid
A common pitfall is confusing phase shifts and horizontal stretches/compressions. Remember to factor out the coefficient of x before determining the phase shift. For example, in the equation y = sin(2x – π), the phase shift is not π, but rather π/2 to the right, because the equation can be rewritten as y = sin(2(x – π/2)). Another common mistake is not applying the transformations in the correct order. While understanding *why* the order is what it is helps avoid rote memorization, it’s still important to understand that A, B, C, and D have specific roles and are generally applied in a certain way.
Final Thoughts on Conquering Sine Graph Transformations
Mastering challenging sine graph transformations practice problems requires a combination of solid foundational knowledge, consistent practice, and the right tools. By understanding the underlying principles, breaking down complex problems, and utilizing resources like graphing calculators and online tutorials, you can confidently tackle even the most intricate transformations. Remember that a deep conceptual understanding is key to long-term success. Share your favorite sine graph transformation techniques in the comments below and explore our other resources for advanced mathematical concepts.

